Preliminary first quarter investment management reports for clients of Financial Planning Associates, Inc. have now been posted in secure online client folders. Final reports will be posted when consumer price index information becomes available.
US large stocks lost some of their value during the month of March. Even so, the first quarter of 2017 has been a good one for investors, the average return for our investment management clients being +3.52%.
Note: The calculation used to determine our clients’ returns is called the internal rate of return. It is cash flow specific and is net of all fees and expenses. It represents the average return experienced by our investors during the period. Investment return information is provided by Morningstar using GIPS standards.
For the past several years US stocks have outstripped most other investment categories. However, during the 1st quarter emerging market stocks, healthcare stocks and international stocks saw superior growth. Shown below are the returns for the period of several representative assets which are included in most of our client accounts.
Note: Unlike the internal rate of return calculation, the calculations for asset class returns are not cash flow specific. They represent the return of the fund, not necessarily the investor.
| Name | Ticker | 3 Mo Return |
|---|---|---|
| Schwab Emerging Markets Equity ETF™ | SCHE | +10.32 |
| Vanguard Health Care ETF | VHT | +8.76 |
| Schwab International Equity ETF™ | SCHF | +7.31 |
| Schwab US Large-Cap ETF™ | SCHX | +5.71 |
| SPDR® S&P Global Natural Resources ETF | GNR | +2.79 |
| Schwab US TIPS ETF™ | SCHP | +1.23 |
| Schwab Intermediate-Term US Trs ETF™ | SCHR | +0.44 |
| Schwab Short-Term US Treasury ETF™ | SCHO | +0.09 |
| Schwab US REIT ETF™ | SCHH | -0.55 |
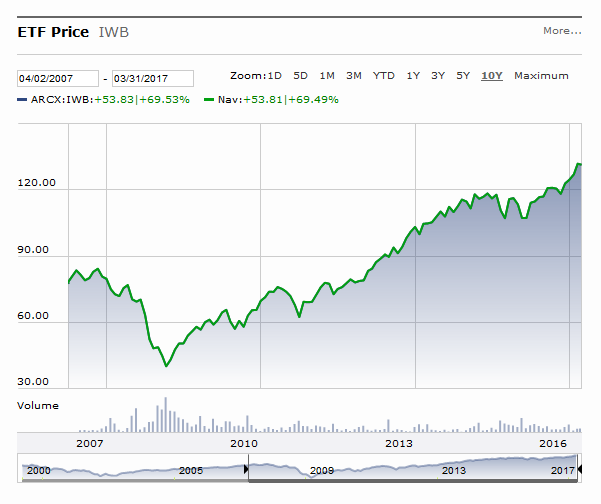
Since the end of the great recession of 2008 US large stocks have gained value as the graphic below illustrates. The picture shows the change in value of the Russell 1000 exchange traded fund for the past 10 years. The Russell 1000 exchange traded fund tracks the changes in value of the 1000 largest US stocks.
After losing nearly 52% of their value from October 31, 2007 to February 27, 2009 US large stocks moved upward in March of 2009. These same stocks have now tripled in value during the subsequent 8 years. Broadly diversified investors values have increased, but not as much as US-only investors during this period.
So, what direction will US stocks take now? There are smart, well-informed expert investors who expect continued upward movement, and there are smart, well-informed expert investors who expect downward movement. Will the Fed continue to raise interest rates? If they do will markets respond negatively? We can look at history for clues, but there are so many variables involved that the present is never exactly like the past. The bottom line: no one knows.
When bakers get bored…


